Document Design |
Users are allowed to customize existing document format or create new documents
with the help of Report
Designer
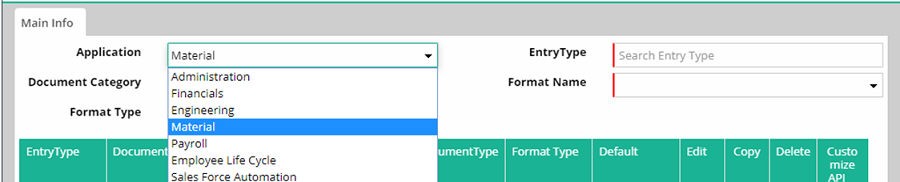
Application: Select the required application where user needs to create document. The already created document list for the selected application gets populated
Users are able to filter record entry type wise, document category wise, format name wise and format type wise as discussed below
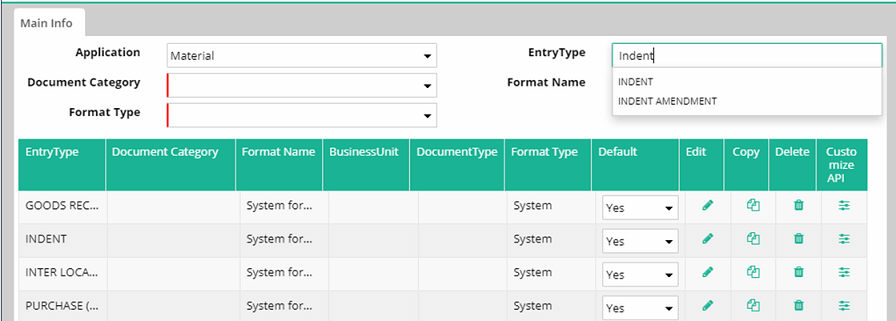
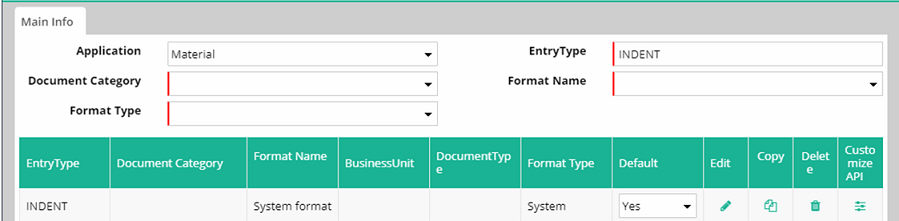
Entry Type: Select the entry type. The record gets filtered based on entry type selected.
Document Category: Select document category to filter record based on document category
Format Name: Select format name to filter record based on format name
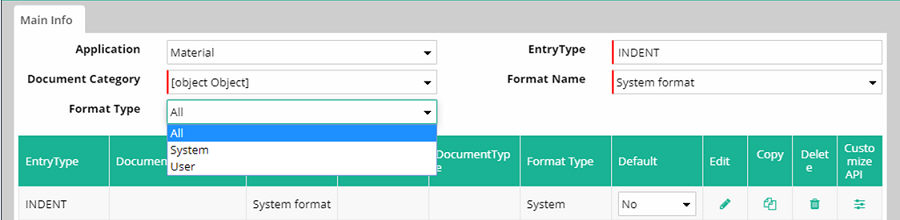
Format Type: Select format type to filter record based on format type
Format Type |
Description |
All |
Displays system formats and user formats both |
System |
Displays only system formats |
User |
Displays only user formats |
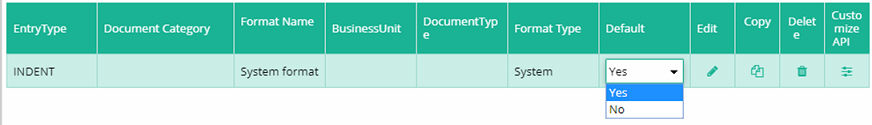
User has option to set the document format as default by choosing 'Yes'. Otherwise set 'No'.
Copy and design
Click on copy icon  to copy
the existing format and make changes in it. The 'Copy Template' popup
window will open
to copy
the existing format and make changes in it. The 'Copy Template' popup
window will open
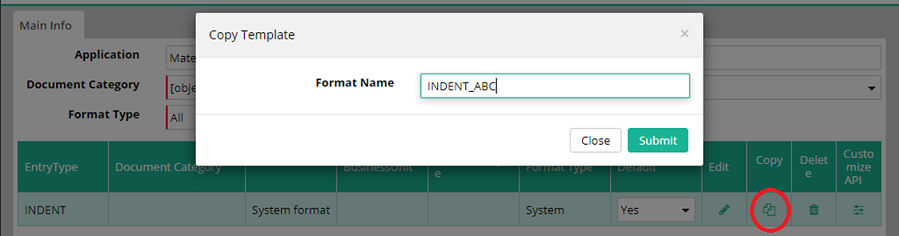
Enter a new Format Name and click on 'Submit'
The report designer will open where users can redesign document or report. Report Designer User Guide.
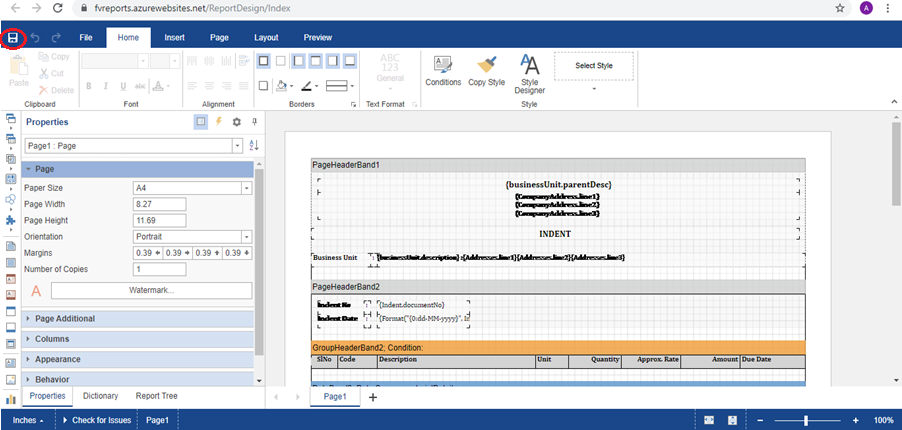
After changes click on the save icon.
The new format will appear in data grid as shown below
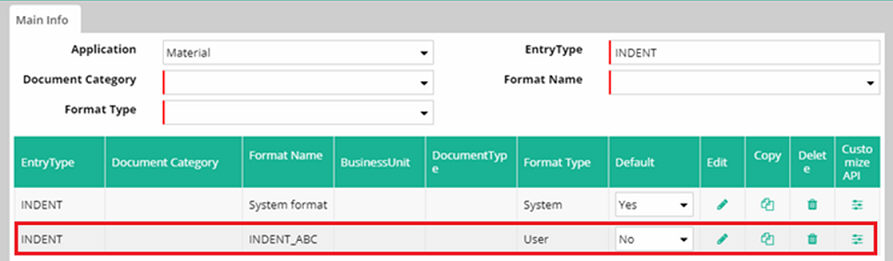
The same can be edited or deleted or customized API (if any dynamic API info exists for the selected entry type then that can be customized by clicking on this icon). Otherwise the following message will be popped up.
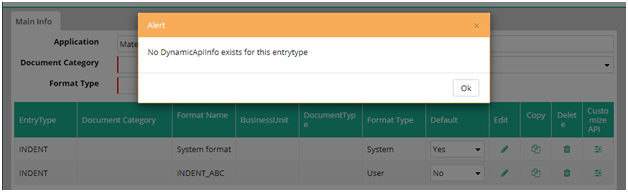
Note:
System format cannot be edited or deleted or customized

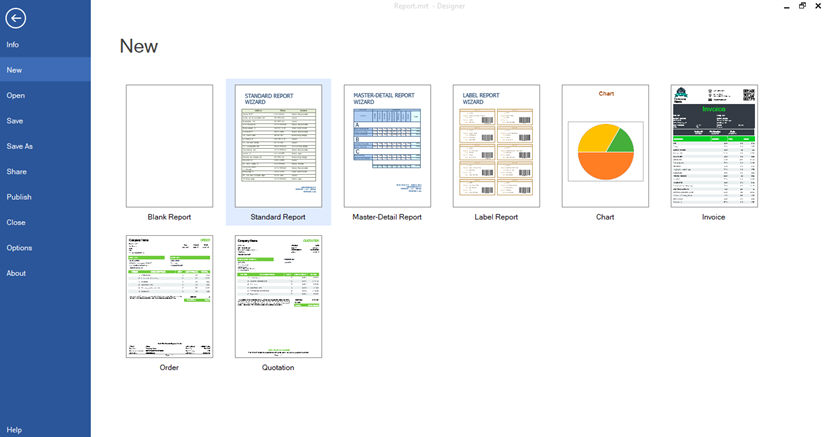
Steps to create a Document design in Report Designer
Go to File > New > Blank Report
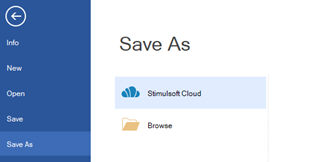
After doing the necessary designing, Go to File > Save As
Select saving path and enter a report name then save the report file.
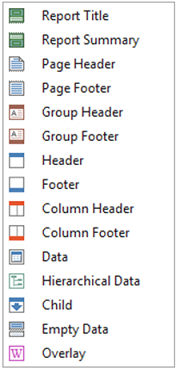
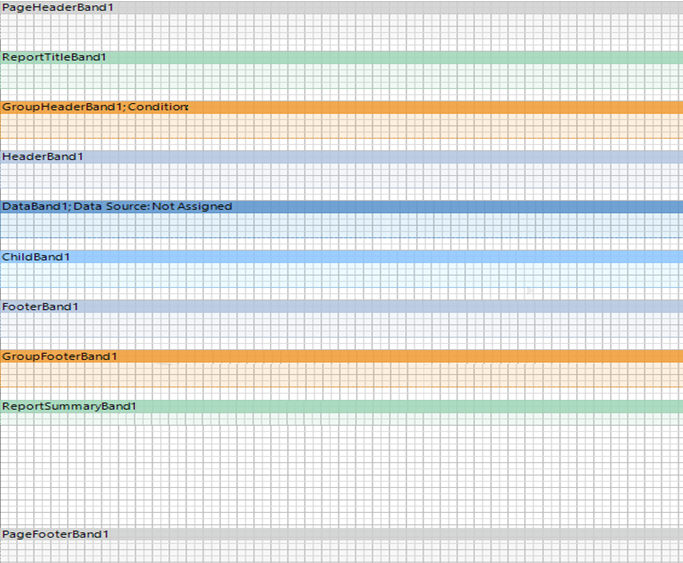
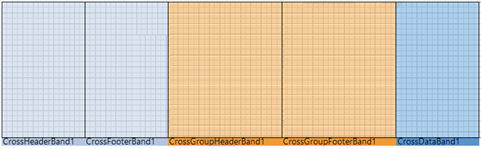
Types of Bands in Report Designer
There are various types of bands used in report designing. They are categorized into two main types as stated below
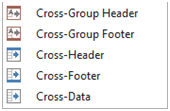
2. Cross Bands
Components used to design a report in Report Designer
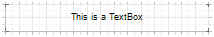
Text:
Text Component is a basic component to print any Static Text,
Data Field. To use a Text Box, user can click on the Text button
and write any text to display in output.
 |
|
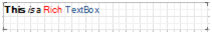
Rich
Text: It is used to provide various type of styles
to the text box such as colorful text, bold, italic, underline.
It also supports for auto size adjustment.
 |
|
Image:
This component is used to place an image file in the report
to display in output.
 |
|
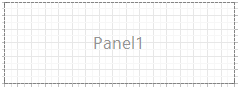
Panel:
Panel is used to create a rectangular region in report which
can contain different types of bands and components. It is used
to provide separation. If the panel is moved then the components
and bands inside that panel will also move. Thus, user doesn’t
need to manually move the content of a panel.
 |
|
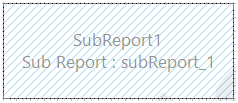
Sub-Report:
It is used to provide a nested complete report inside any
components, bands or panels.
 |
|
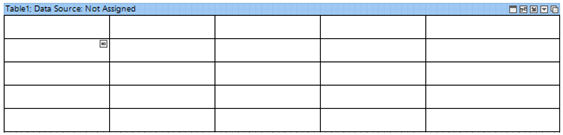
Table:
It is a standard component in Report Designer that is used
to show data in tabular structure in output.
 |
|
Zip Code:
It
is a special type of band used to print Zip Code in Zip Code type
of format.
 |
|
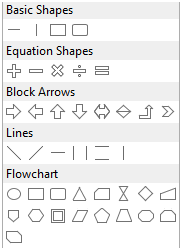
| Shapes: The Shape element can be placed anywhere on the dashboard. The setting of the Shape element is carried out in the shape editor. It is used to add various types of shapes such as Line, Rectangle, Polygon, Circle, Pentagon, Hexagon etc. | |
 |
Fill: A property that is used to change the brush and fill color of a shape in the current element.
Shape Type: Changes the type of a shape in the current element.
Size: Changes the outline width of a shape for the current element.
Stroke: Changes the outline color of a shape.
Back Color: Changes the background color of the Shape element. By default, this property is set to form Style, i.e. the color of the element will be obtained from the settings of default style.
Border: A property that allows user to customize the borders of a table such as color, sides, size, and style.
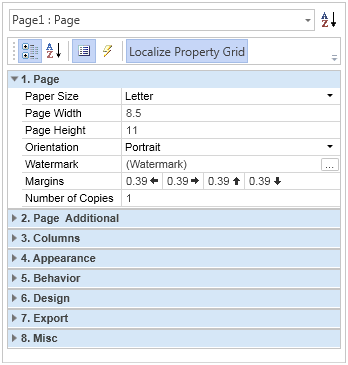
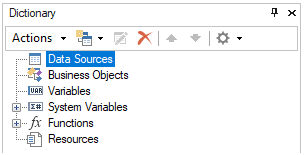
The navigation panel contains different properties, functions and commands to control various components of a report. User can use this panel to access data source, create data source, modify fields, access variables, functions, report tree, properties of a component, etc.
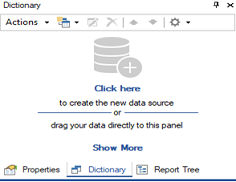
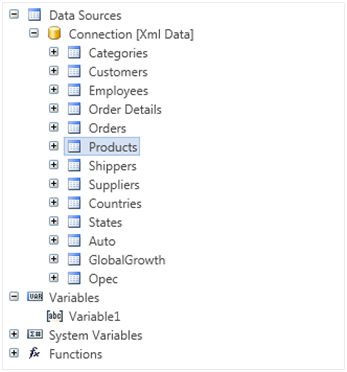
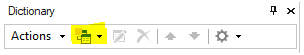
Dictionary: The Dictionary panel shows the connected data, available data sources, system variables and functions. User can also add new data source, columns, variables etc.
Properties: This panel shows all the features of the selected component, and also its events. User can also modify those features according to their needs to work properly.
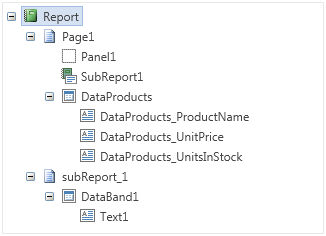
Report Tree: Report Tree shows the hierarchy of all used bands and components in the form of a tree like structure.
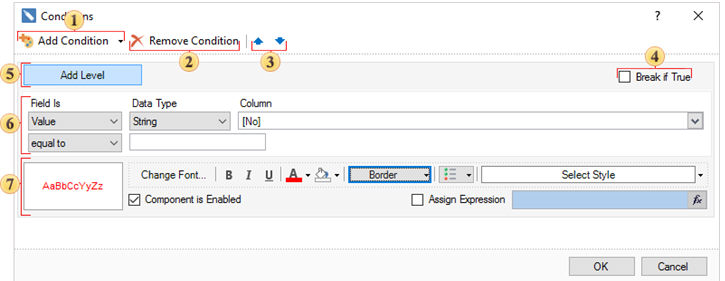
Conditional formatting allows user to change the design of components, depending on certain conditions. Here, user can able to set different types of properties like Text color, Text size, Font settings, border, style, bold / italic / underline and even either that component should be displayed or not. User can also add condition based on a field value or customized expression. It also supports for AND / OR functionality.
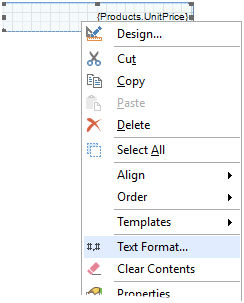
The Text Format is the basic tool for formatting a text before output. This tool is a dialog box, which allows setting parameters of format. Text format dialog box is called from the context menu, that appears when right-clicked on the text components, which supports formatting.
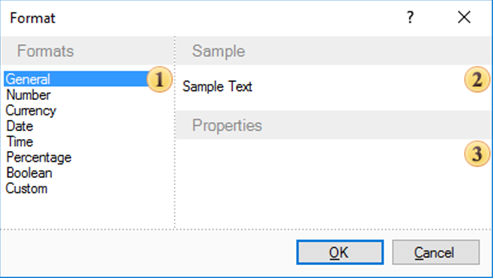
Types of formatting:
1. General: For all type of data
2. Number: For Number type data
3. Currency: For Currency based field
4. Date: For formatting date properties
5. Time: For formatting time properties
6. Percent: To show data ending with ‘%’ symbol
7. Boolean: True / False value formatting
8. Custom: User defined formatting settings
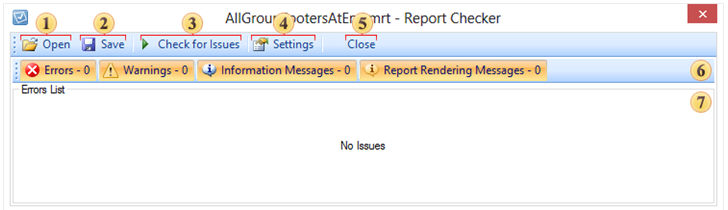
To compile a report, press check for errors button located above the report designer status bar. It is a tool provided to check for all the errors formed while designing a report before using it. Here, is how reports errors.
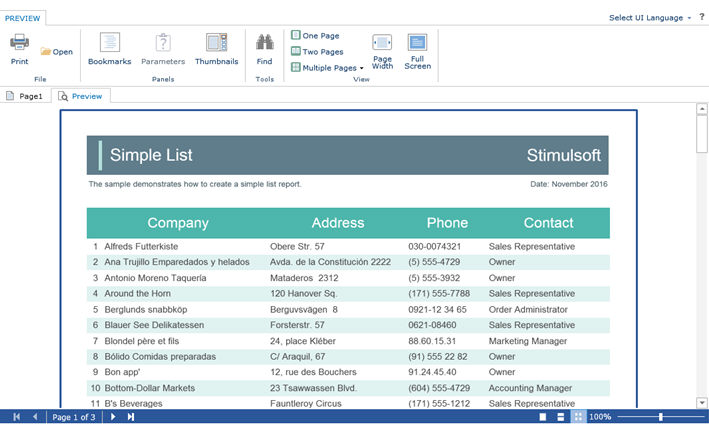
Previewing report is an option provided to show the estimated output of that report file. That, when it is executed in real time, it gives a demonstration how it will look.
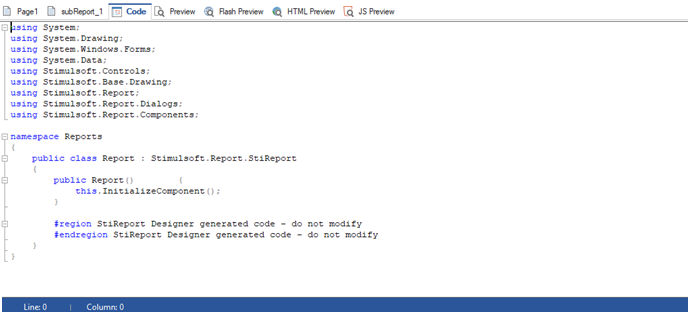
Sometimes it may happen that the in-built functionality is not sufficient to make a complex report. Thus, there is a Code Tab in designer to add some custom methods in C# and call that method from the components to get the work done.
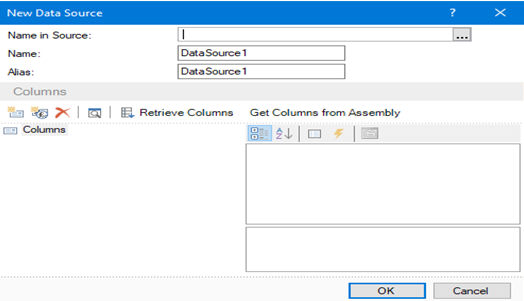
Following are the steps to create a Data Source.
1. Go to Navigation panel on the right side of Designer.
2. Click on Dictionary tab.
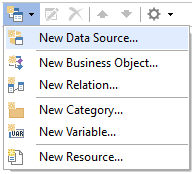
3. Then click on the button next to Action button located on header.
4. Select New Data Source.
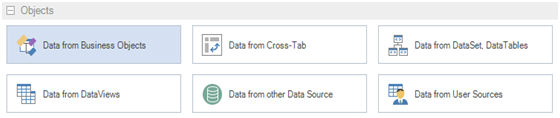
5. Expand Objects by clicking the ‘+’ symbol and then Select Data from Business Objects.
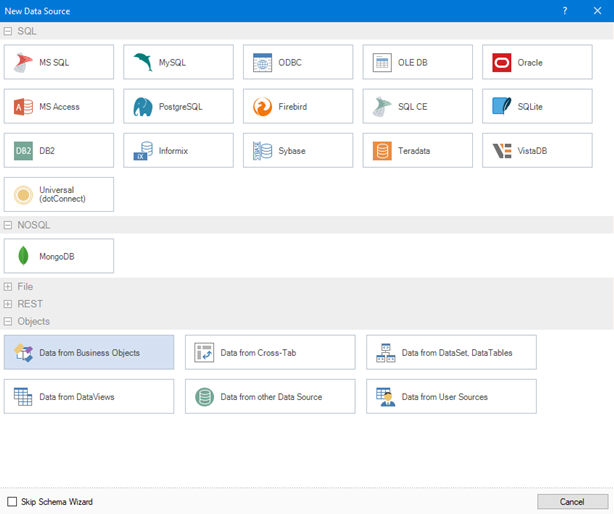
6. Type a Schema name in ‘Name in Source’ field.
1.
7. Type a table name in Name and type same name in Alias.
8. Click OK.
Following are the steps to create a Table inside a Schema.
1. Go to Navigation panel on the right side of Designer.
2. Click on Dictionary tab.
3. Expand Data Sources by clicking the ‘+’ symbol.
4. Expand the Schema in which user needs to create a table.
5. Right click on the Schema then select new Data Source.
6. Expand Objects by clicking the ‘+’ symbol and then select Data from Business Objects.
7. Type a Schema name in ‘Name in Source’ field.
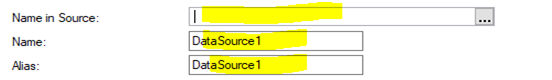
8. Type a table name in ‘Name’ field and type same name in ‘Alias’ field.
9. Click OK.
Creating new Column in a Table
These are the steps to create a column inside a table
1. Go to Navigation panel on the right side of Designer.
2. Click on Dictionary tab.
3. Expand Data Sources by clicking the ‘+’ symbol.
4. Expand the Schema in which table is located.
5. Right click on that table and Select New Column.
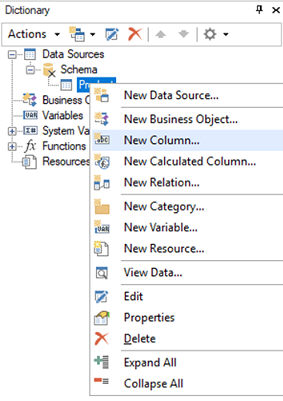
6. Type a column name in ‘Name in Source’, ‘Name’ and ‘Alias’.
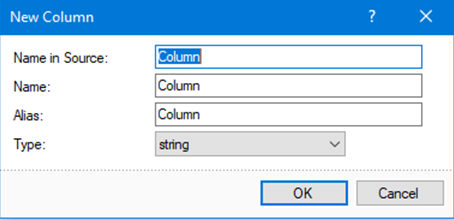
7. Select a data type from the drop down.
8. Click OK.
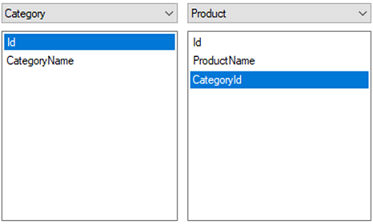
Relation is used to access fields of any other table inside a table. It is necessary to have a common data field with same data type in both the tables to create Relationship. Follow the steps to create a Relation.
1. Go to Navigation panel on the right side of Designer.
2. Click on Dictionary tab.
3. Expand Data Sources by clicking the ‘+’ symbol.
4. Expand the Schema in which table is located.
5. Right click on that table and Select New Relation.
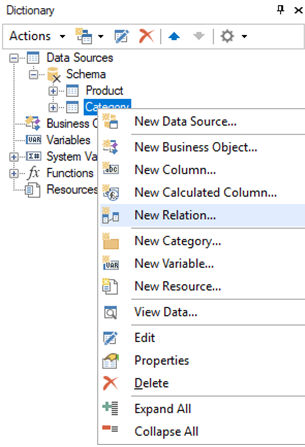
6. Provide a relation name in ‘Name in Source’.
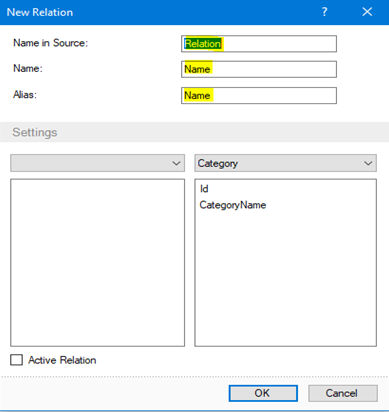
7. Provide that name in ‘Name’ and ‘Alias’ too.
8. Select a Parent Table and Child Table from the drop down.

9. After that from the left panel select the Common Field for which the relation will be created.
10. Click 'OK'
Following are the steps to import an existing .xsd file to create dictionary tables and their columns and relations.
1. Go to Navigation panel on the right side of Designer.
2. Click on Dictionary tab.
3. Then click on the Action button located on header.

4. Select Import XML Schema option.
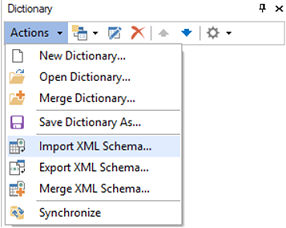
5. Browse for the XSD file in PC.
6. Then Type a Schema name.
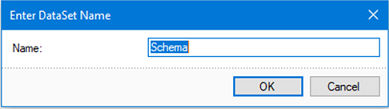
7. Click OK.
Following are the steps to export an existing Dictionary into a file having extension as .xsd.
1. Go to Navigation panel on the right side of Designer.
2. Click on Dictionary tab.
3. Select the Data Source.
4. Then click on the Actions button located on header.

5. Select Export XML Schema option.
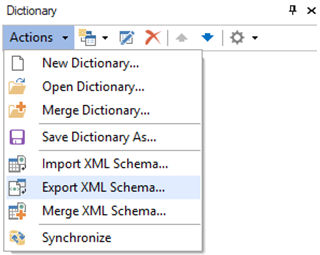
6. Browse a location for saving.
7. Provide a Filename.
8. Type a Schema Name.

9. Click OK.
Some useful Properties of Report Components
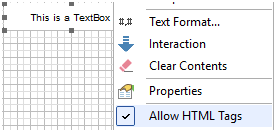
1. Allow HTML Tag: This is an option usually used for Text box to display HTML tag binding styles. Eg. <b> to Bold, </br> to print text in a new line.
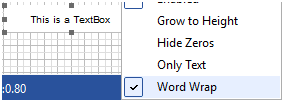
2. Word Wrap: This is an option usually used in Text box inside Data Band to shift extra characters to next line when width of the Text box gets smaller than the text length.
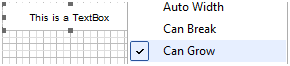
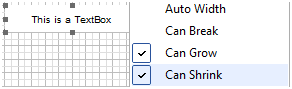
3. Can Grow: This is an option used to dynamically increase the height of a Text Box if text becomes very small in size.
4. Can Shrink: This is an option used to dynamically decease the height of a Text Box if text becomes very large in size.
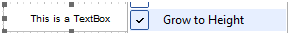
5. Grow to Height: This is an option used to align the height of all the Text boxes that are horizontally placed to same height. It is mainly used in Text boxes of Data Band.
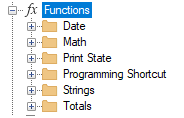
Some Commonly used Built-in Functions
Following are the functions provided by Reports Designer to help in writing custom filtration of data.
1. IIF: This is a conditional statement to provide IF - ELSE condition. It means that if the condition is 'TRUE' then true statement else false statement.
Syntax: IIF(Condition, True statement, False statement)
2. Round: Round function is used to round off a decimal value. Specifically used for Amount.
Syntax: Round(FieldName, rounding digit)
3. Sum: Sum is a function to calculate sum of a field mainly inside a Data Band or Group Band.
Syntax: Sum(FieldName), Sum(FieldName1 + FieldName2)
Some Frequently used Stimulsoft Expressions
1. To print a particular date in format like., 15 December 2015
If we want to print Voucher date in above format
{Format("{0:dd-MMM-yyyy}",Header.VOUCHERDT)}
2. To add a certain number of days in the particular date
If we want to display some days after today.
{Format("{0:dd-MMM-yyyy}",Today.AddDays(15))}
3. To find difference between two specified dates
{Round((double)DateDiff(Date1,Date2).Days)}
4. FIGURE TO WORDS eg. If we want to print 2=Two, 3=Three, etc.
{ToWords(ApplicationHeader.INTERESTPER)}
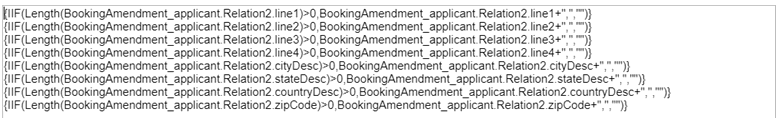
5. If something is present in field then it will be printed along with its caption otherwise nothing will be printed
If co-applicant is there, it will be printed like: Co Applicant : Name of Co-applicant.
{IIF(Length(COAPPLICANT_DTLS.COAPPLICANTNAME)>0,"Co Applicant:"+COAPPLICANT_DTLS.COAPPLICANTNAME,"")}
6. When we know that the text field may grow if data is large
then in such cases, SELECT THE TEXT AND ENABLE “ CAN GROW “ PROPERTY TO TRUE
7. For printing any amount in figures to amount in words:
{ToCurrencyWordsEnIn("Rupees", "Paisa",Round(HEADER.DEDUCATION_AMT,2), 2, false)}
8. For printing COLUMNWISE SUM:
{Sum(PAYMENT_DTLS.RECEIVED_AMOUNT)}
9. To find Percentage of a particular field:
Here I have calculated 10% of the consideration amount.
{(decimal)Header.TOTAL_CONSIDERATION*(decimal)0.10}
10. For making any text within a paragraph to BOLD:
Enclose the text between HTML tag <b>......</b>
And enable ALLOW HTML to true.
11. For making, any figures in comma separator like 19,500.00
Select the text first, go to text format and enable the required settings.
12. For printing data in the form of table:
Take HEADING things in the GROUP HEADER BAND.
Take data that will come from database in the forms of multiple rows if any in DATA BAND and select the data source.
Take GROUP FOOTER BAND at last.
And If you want to display any column wise sum then put total field there in GROUP FOOTER BAND else keep it empty.
13. To Use Amount in Indian Separator:
{Substring(string.Format(new System.Globalization.CultureInfo("hi-IN"), "{0:c}",
BookingAmendment_bookingAreaDetails.unitChargeGrossLcy),1,25)}
14. To use more than one If condition:
{Switch(PAYMENT_DTLS.header.PAYMENTMODE=="D","Demand Draft No.",PAYMENT_DTLS.header.PAYMENTMODE=="C","Cheque No.",PAYMENT_DTLS.header.PAYMENTMODE=="P","Pay Order No.",PAYMENT_DTLS.header.PAYMENTMODE=="E","EFT No.",PAYMENT_DTLS.header.PAYMENTMODE=="JV","Journal Voucher")}
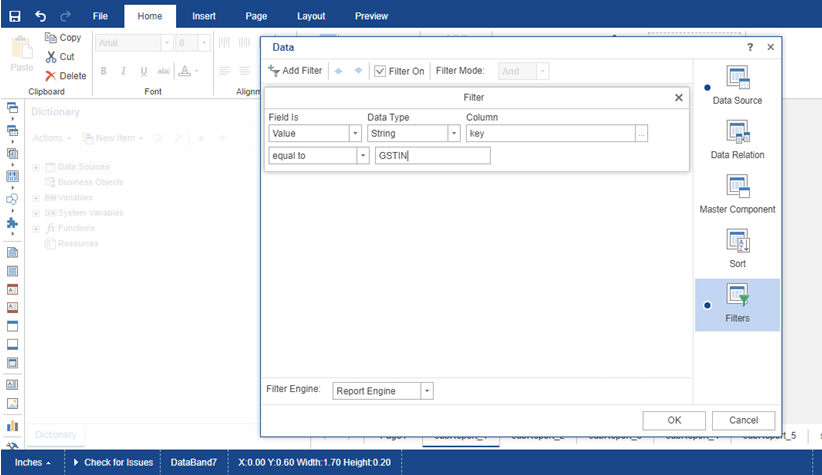
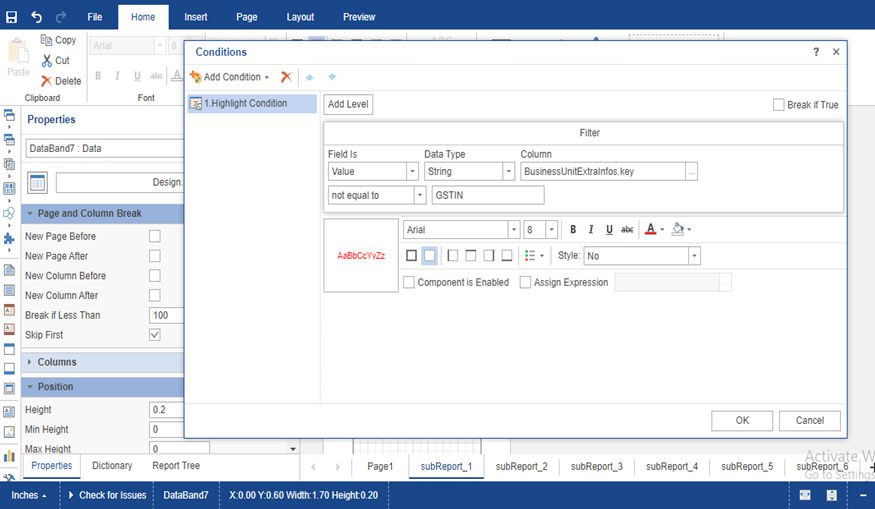
15. Hide Data with Conditional Function:
Two ways to hide data
I. Data Filtration in a Band
II. Condition based in a band
Here is the following images
I. Data Filtration
II. Condition Based
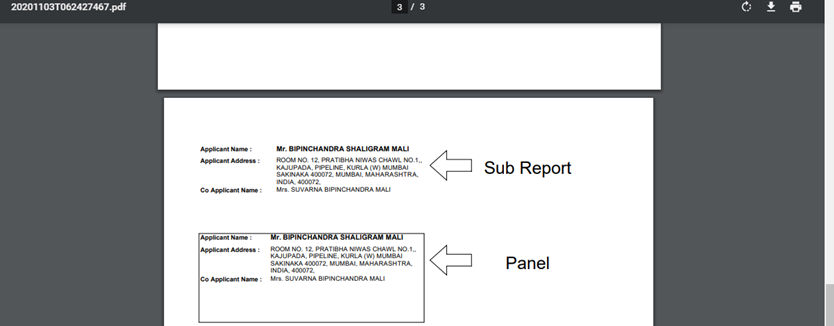
16. Concept of Sub Report and Panel:
I. Sub Report: Sub Report is used for reflecting a New Report page inside a band. Please see the following Images.
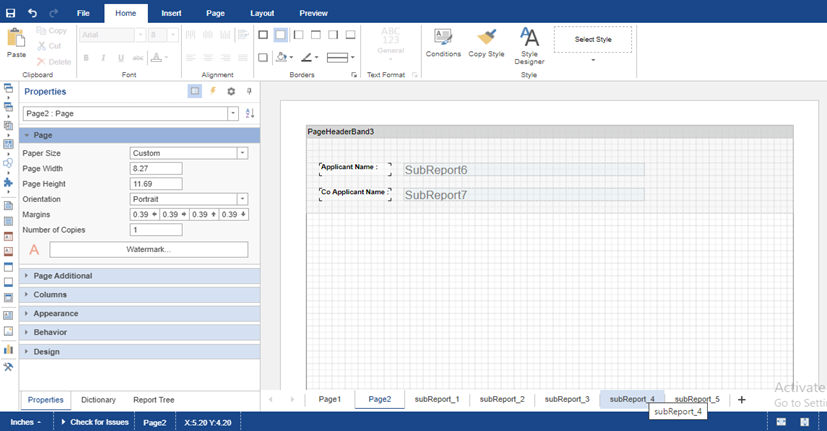
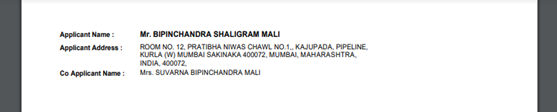
II. Panel: Panel is a rectangular region that may contain other components including bands. If to move a panel then all components in it are moved too. Sub Report and Panel Uses are almost the same.
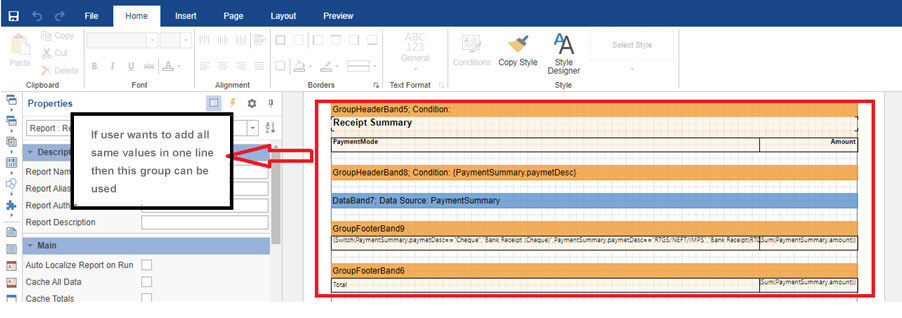
17. Grouping Uses: Always use Group Header Band -> Data band-> Group Footer Band in one Group. And which table you want to group please assign the same in the Data band. Please refer the image below.
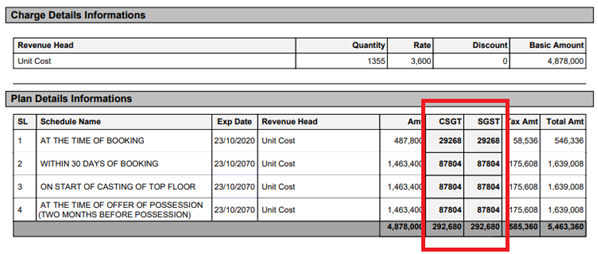
18. For reflecting CGST and SGST Value: Use {Tax amount Field/2}
19. Column to ROW : {Func.EngineHelper.JoinColumnContent(DataSourceName, "FieldName", ",")}
20. To remove any data from any field: {Remove(AreaInfo.floorDesc,0,6)}
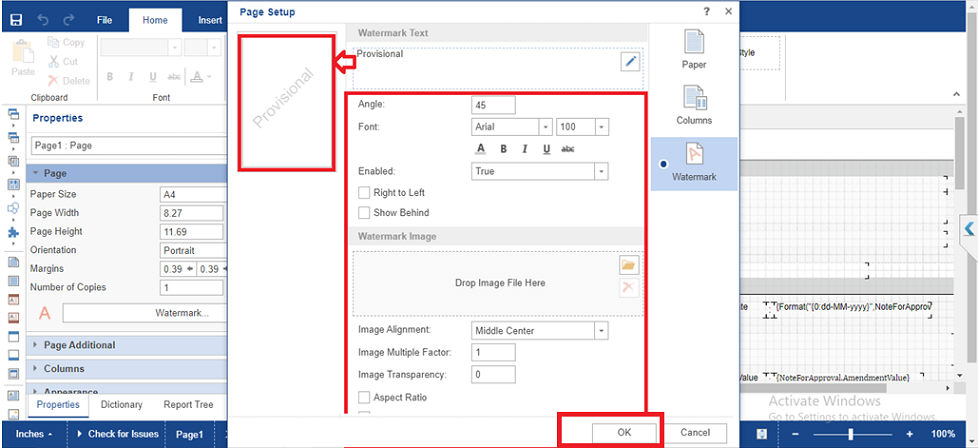
21. For watermark: Following steps are to be followed
Step1: Go to Watermark Option from Properties. Click on the same.
Step 2: Go to the edit marked option and write the text which you want to. For editing your text you can click on more options.
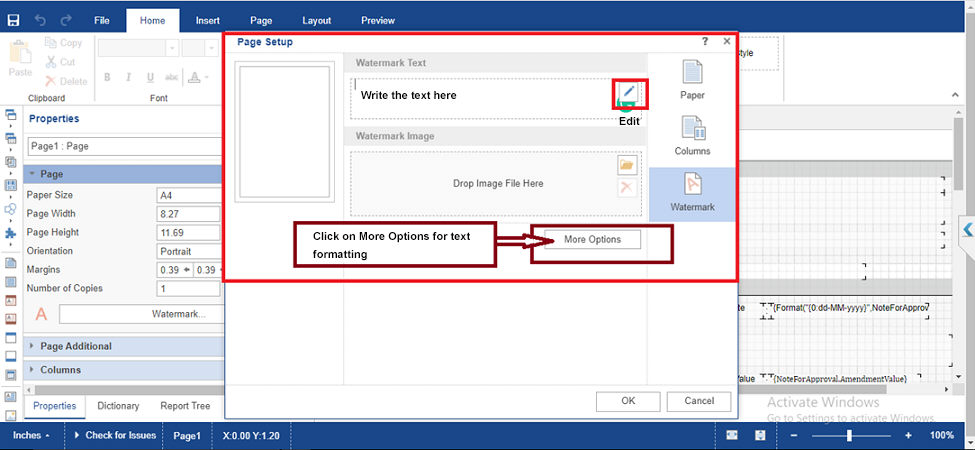
Step 3: Then click on OK.
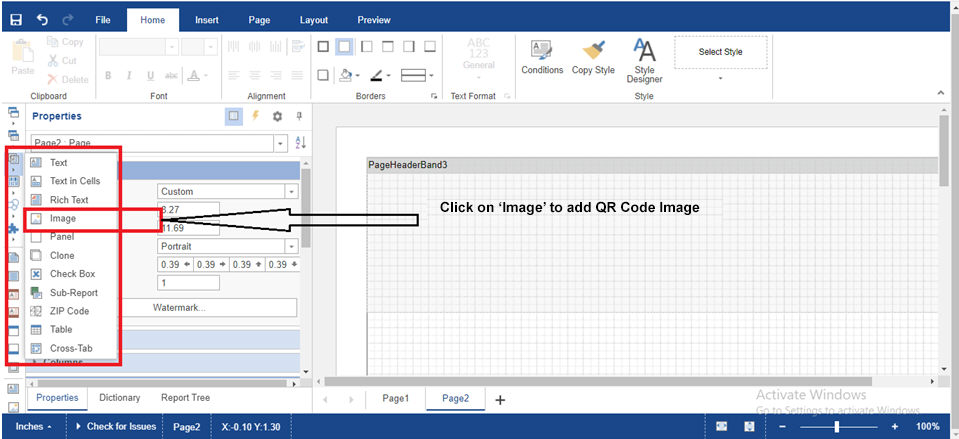
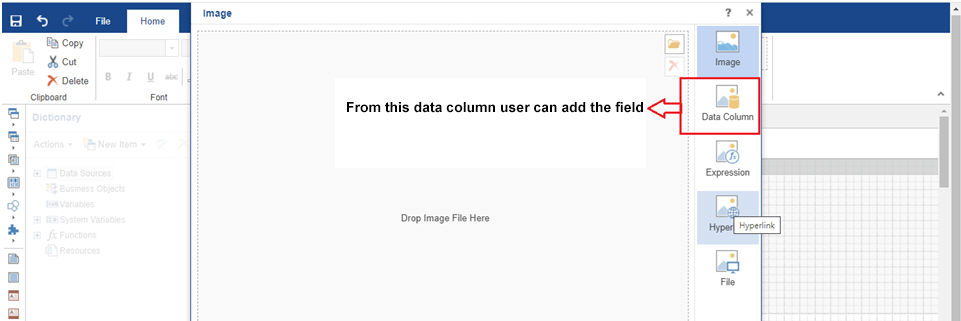
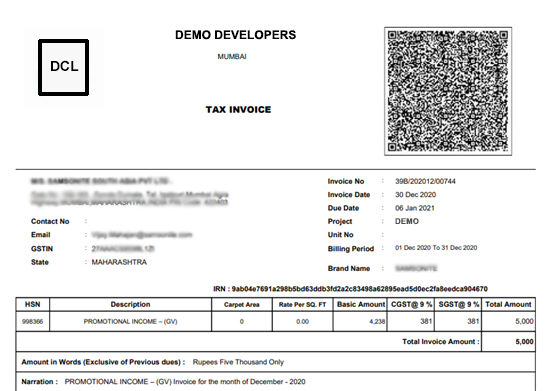
22. E-invoicing: The QR Code image should be placed in the Header option
Step1: From Properties click on image option as per the following screenshot.
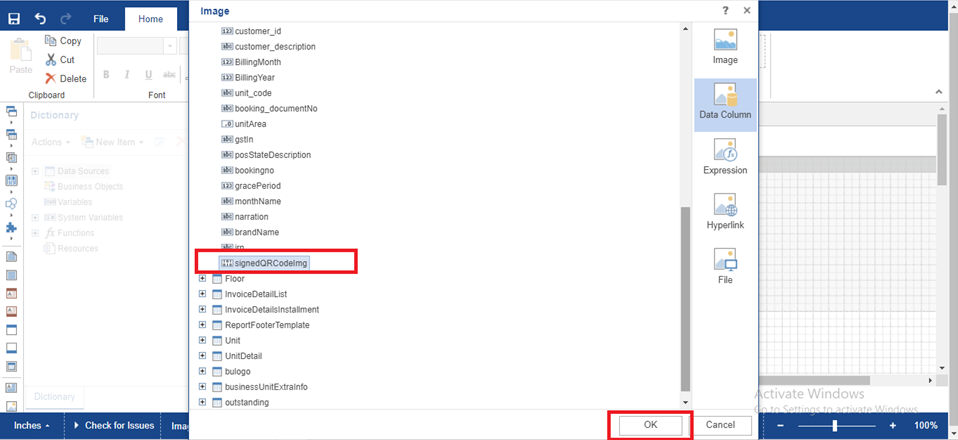
Step2: A dialogue box will open. Then go to the Data Column option.
Step3: Find the Field from the sources. Click on the field and click on OK.
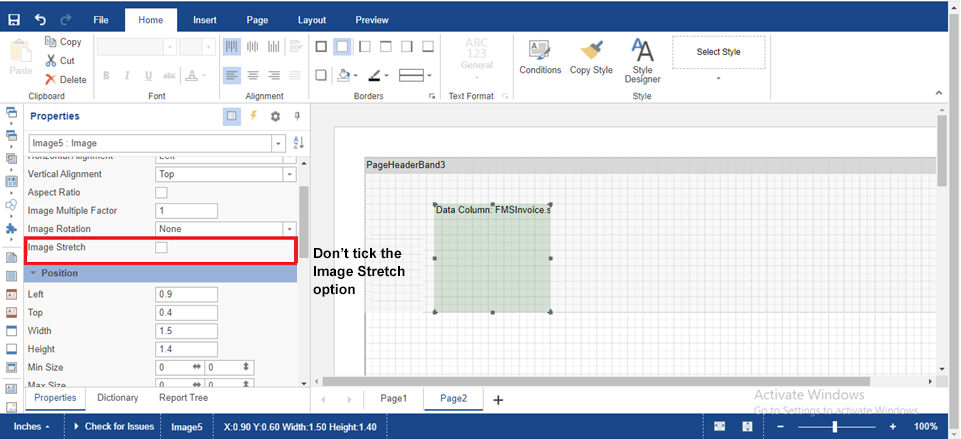
Step4: Please note don't tick the stretch option and can grow option.
Step5: Enter width and height as per the following screenshot.
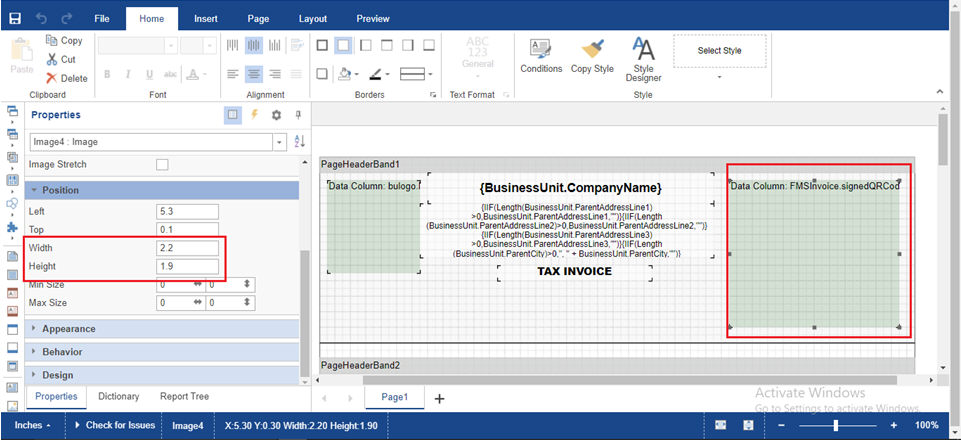
Final Output will be as shown below:
Some Frequently asked questions and their answers
Q1.Why designer will use DataBand
Answer: For any case If data return more than one row, then use DataBand. Like Applicant, Co-applicants, address(s), Late Payment Fees etc.
Q2. Why designer use condition in address
Answer:
1. Address has multiple fields, like address 1 , address 2 , address 3 and every fields may not have data.
2. And If one text has multiple fields, designer must use condition.
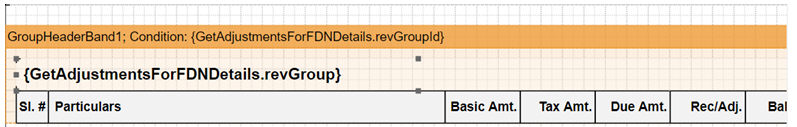
Q3. How to do grouping and what is the key fields for revenue head grouping
Answer:
To do grouping,designer must need a key field. Like revenue head grouping
And to do grouping of revenue head, the key filed name is revGroupId under the schema name GetAdjustmentsForFDNDetails
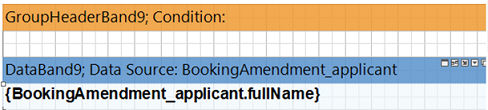
Q4. Is the DataBand source schema name and schema name of the field under the same DataBand shall be same?
Answer:
Yes, designer always remember that the DataBand source schema name and the field to use under the same DataBand must have same schema name.
Like below example for applicant name the schema name is BookingAmendment and data source schema name of DataBand 9 also BookingAmendment.
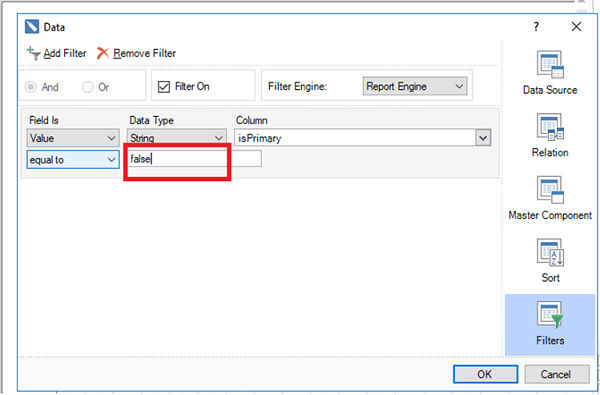
Q5. How to design the primary Applicant name
Answer:
Take PageHeaderBand, under the PageHeaderBand take SubReport
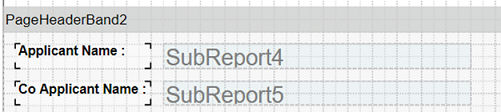
In SubReport take DataBand, remember DataBand Data source(Schema) must be same as Data Source(Schema) of the field.
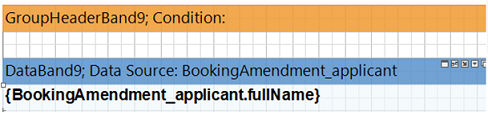
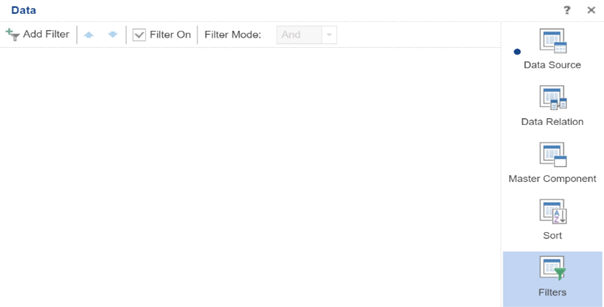
In DataBand data source apply filter IsPrimerywhich is the key field to differentiate the Primary Applicant and Co-applicant. For primary applicant IsPrimarywill be True. To apply filter double click on DataBand
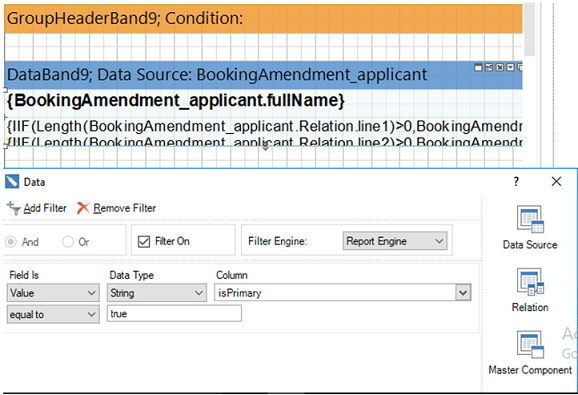
And for co-applicant it will be false
Q6. What can be the design issue if data not comes or incorrect data comes in any fields?
Answer:
After completion of the design in output files if data not shows in any fields, hence designer shall be below mentioned design issue primarily
i. Use of tabular data shall not be designed in PageHeaderBand directly
ii. Where output will return multiple rows, please check designer used the data band or not
iii. DataBand source schema name and field schema name under that DataBand is same or not
iv. Check If one text has multiple fields, designer used condition or not
Q7. How we can copy text from other documents like MS Word or PDF files?
Answer:
For text, designer shall copy the same from source file like MS Word and PDF and first paste the same in notepad and from notepad can copy the same paste in design.
© Gamut Infosystems Limited